Imagine you have a spreadsheet of customer orders. And now consider how you would take that spreadsheet and be able to answer the following:
- Which UK regions have generated the most orders?
- Which UK counties have generated the least orders?
- Where do I need to focus my marketing efforts?
- Where am I losing revenue?
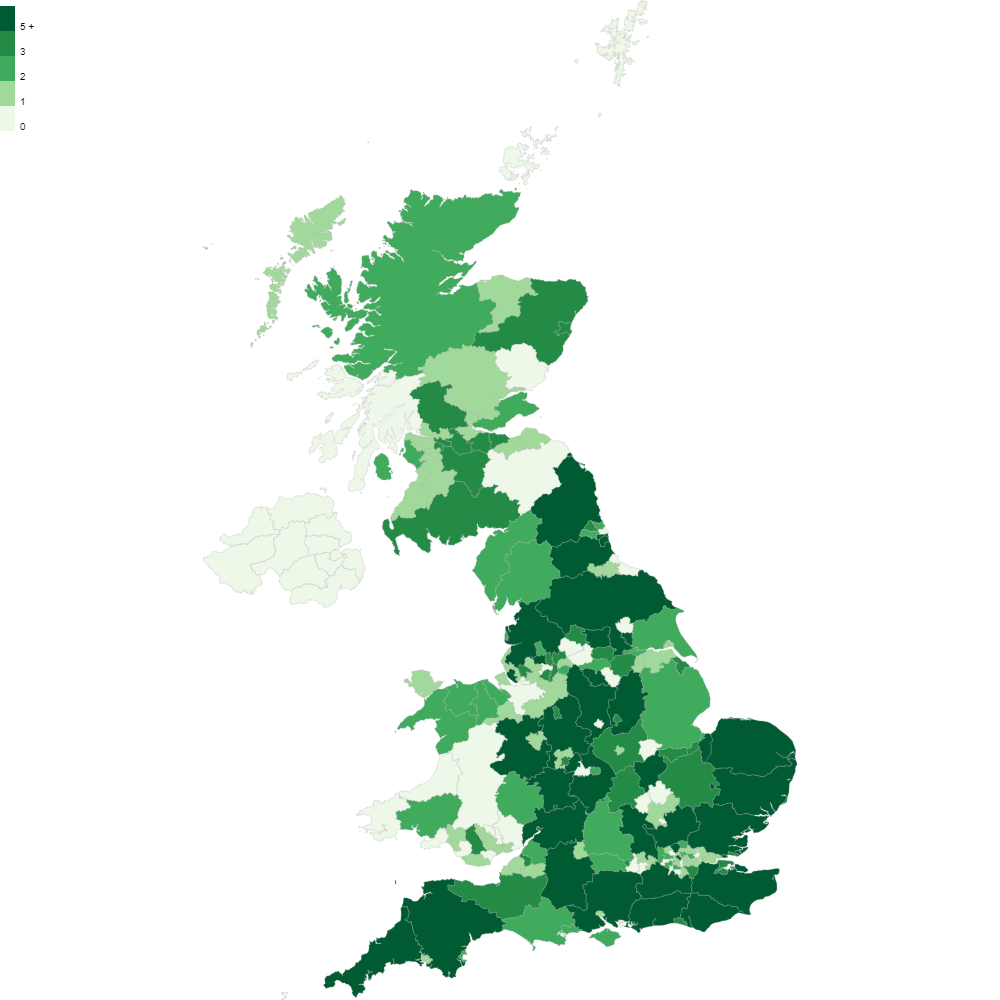
A postcode heatmap visualisation can help to make sense of this data and answer these kinds of questions by showing the density of customer orders by county, region and many other UK boundaries in a way that is easy to digest and understand at a glance.
Such a visualisation would normally require the use of expensive and complex software, or maybe even the help of a professional software developer.
So how can you easily create your own? Using postcodeheatmap.com you can follow three easy steps.
Step 1
Select a spreadsheet
Your spreadsheet could contain data such as customer orders, sales, deliveries, sign ups – anything where you have collected a valid UK postcode. Take this spreadsheet for example.
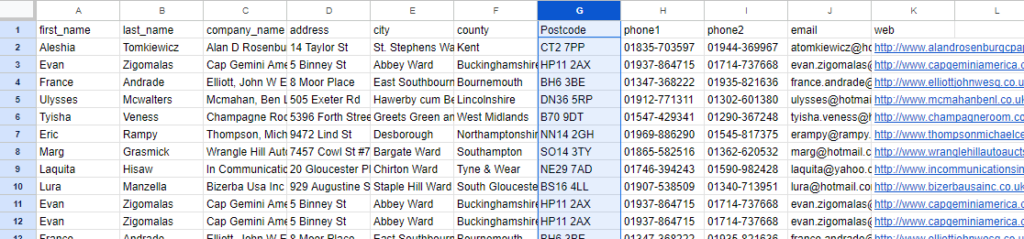
The important thing is that your spreadsheet contains a column for postcodes.
Once you have opened your spreadsheet in a program such as Microsoft Excel or Google Sheets, simply download it in .csv format.
Step 2
Import your spreadsheet
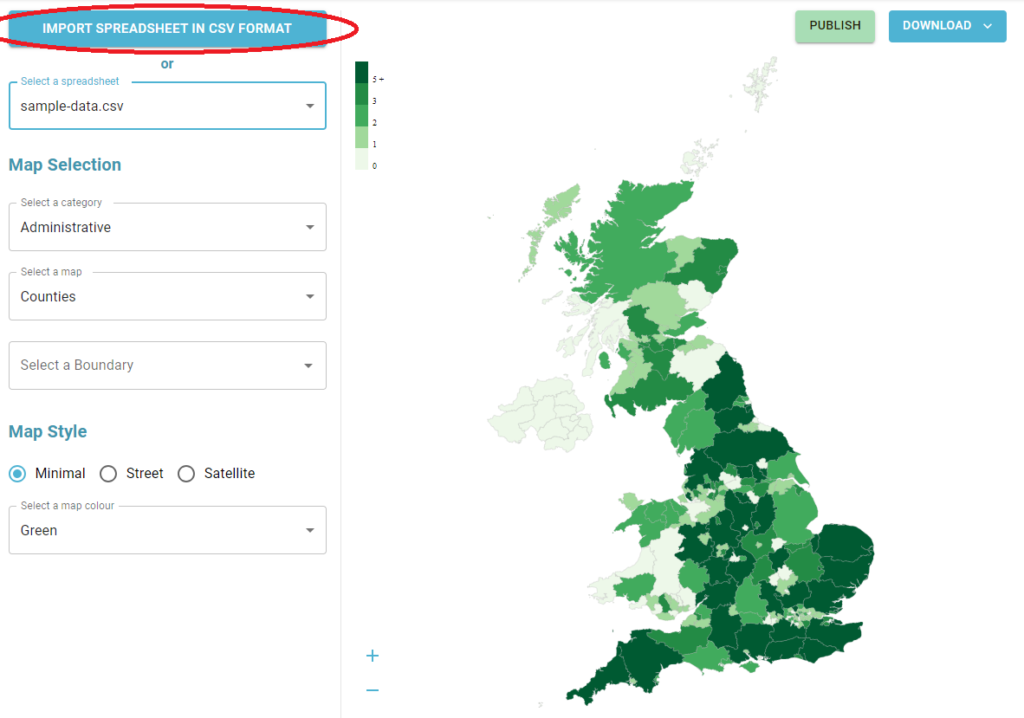
After signing up to postcodeheatmap.com, you can import your spreadsheet by clicking the button pictured below.
You will then see your spreadsheet displayed in front of you. This is when you tell postcodeheatmap which column in your spreadsheet contains the postcodes. You can do this by checking the checkbox displayed above the column. See in the picture below.
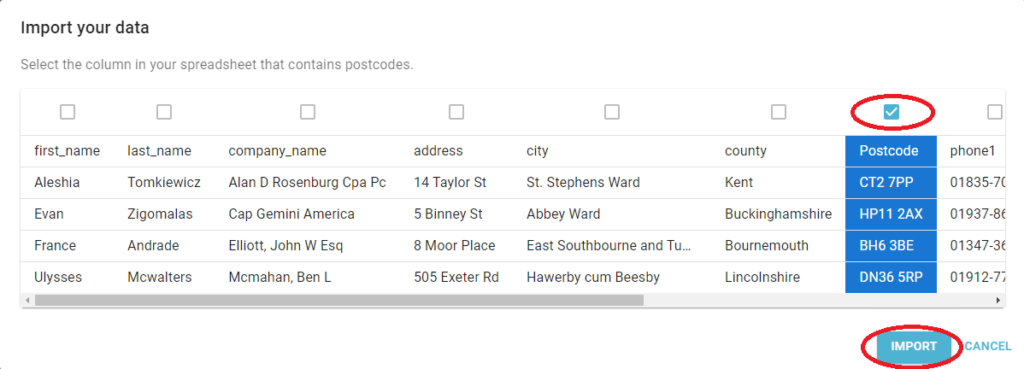
Now go ahead and click the “import” button. This may take a moment depending on how much data is in your spreadsheet.
Step 3
Export your postcode heatmap
Once the spreadsheet import is complete, you will then see your beautiful postcode heatmap ready to be downloaded and embedded in your reports or presentations.
You might choose to customise the style or colour of your heatmap to better suit your companies branding. Or perhaps you want to visualise your data by region rather than county, or even focus on a specific county and get more granular insights.
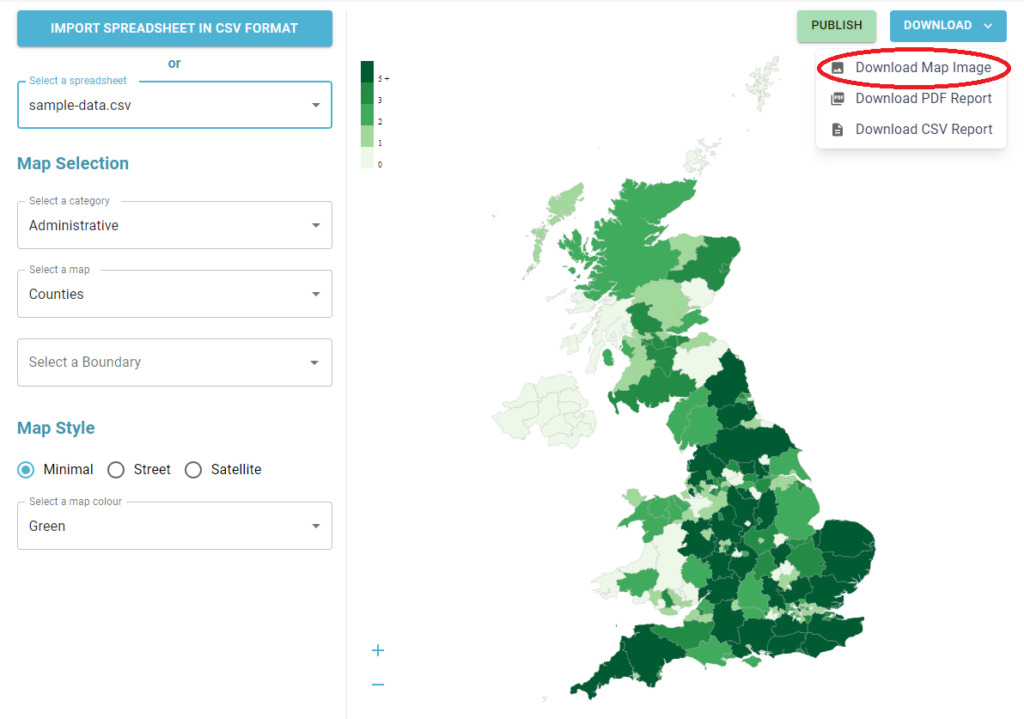
When you’re ready, simply click “Download” > “Download Map Image”. This will download a high quality image in .png format. It will also have a transparent background.
And that’s it! Super simple. Try it out for free by going to postcodeheatmap.com.