
A postcode heatmap that aggregates your postcode data by UK counties and regions offers a great way to visualise geographic data more broadly. But what if you want a more granular view? Perhaps your business only operates within a specific urban area, or maybe you need a more focused breakdown of data.
Using postcodeheatmap.com you can easily create beautiful heatmap visualisations of specific cities in the UK.
Here are some examples:
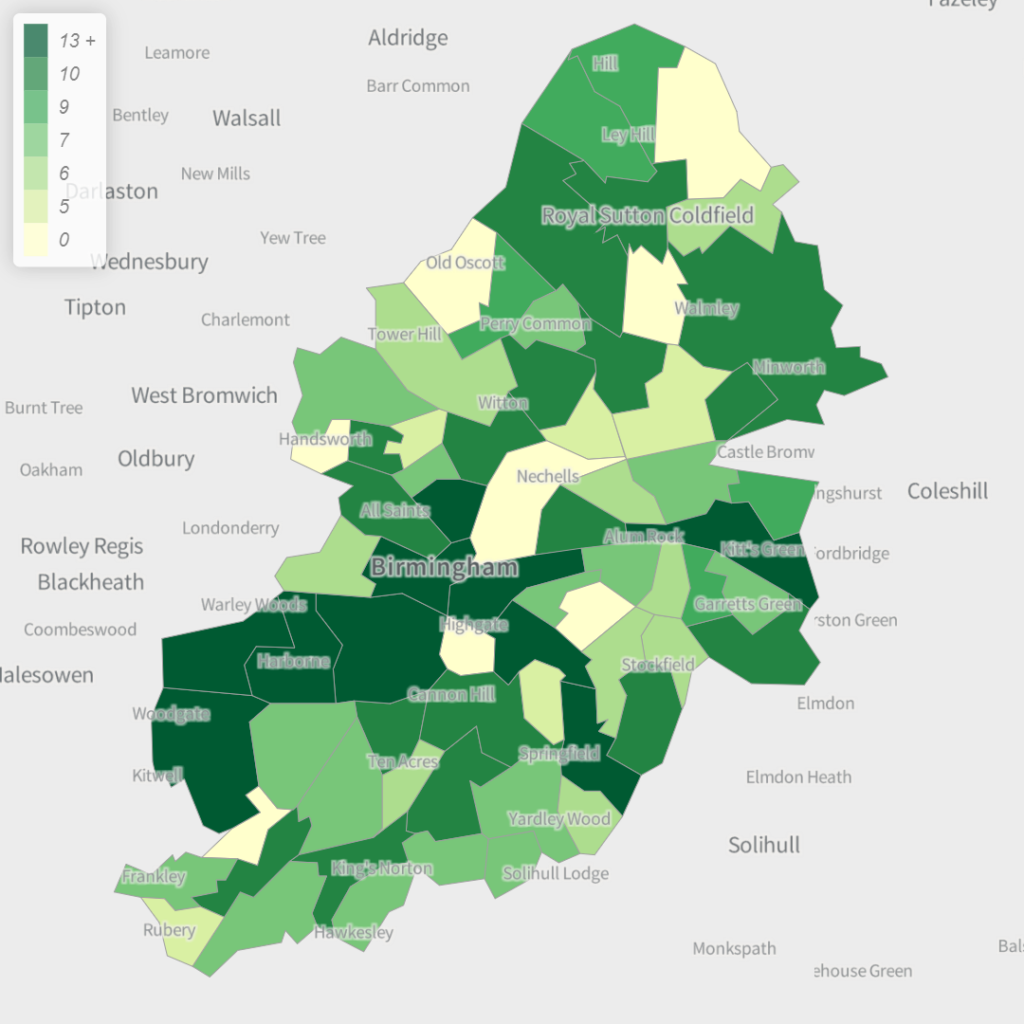
Birmingham
Customer orders month to date
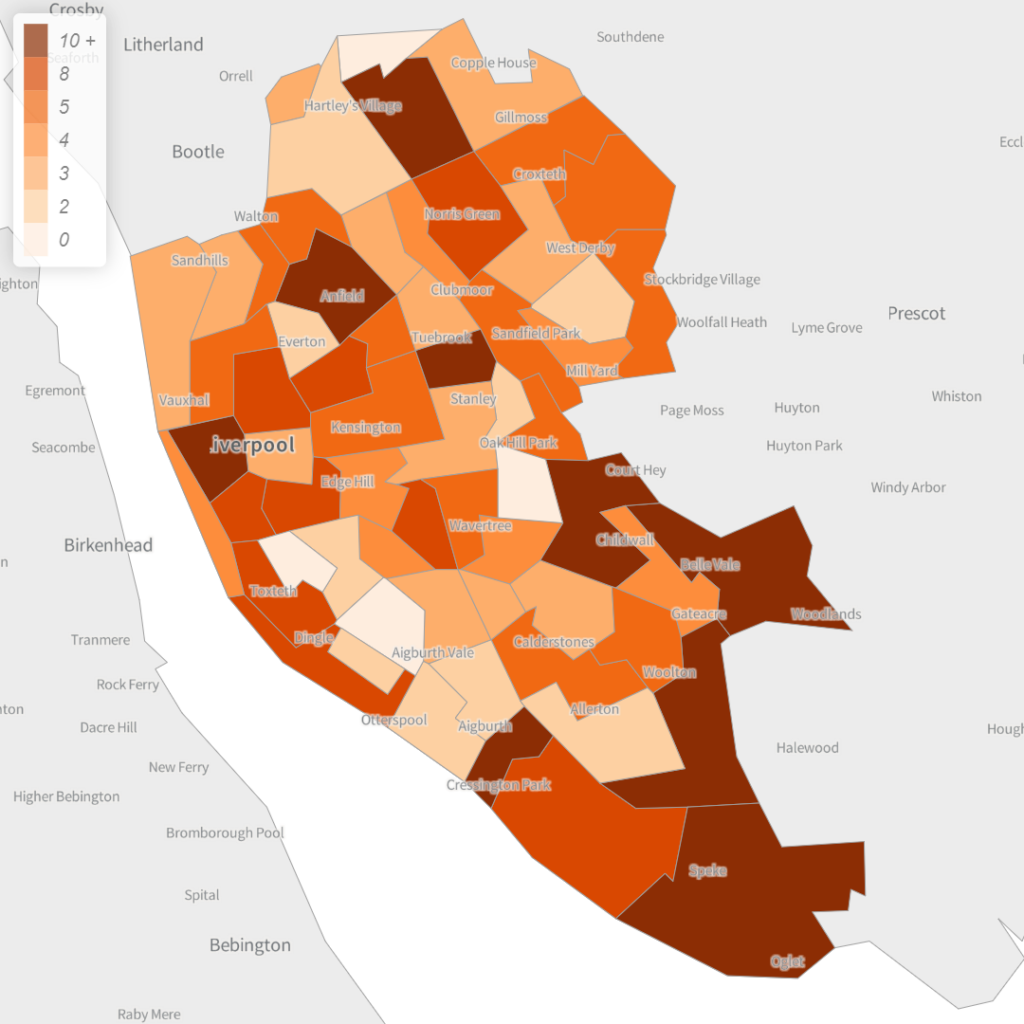
Liverpool
Deliveries for last year
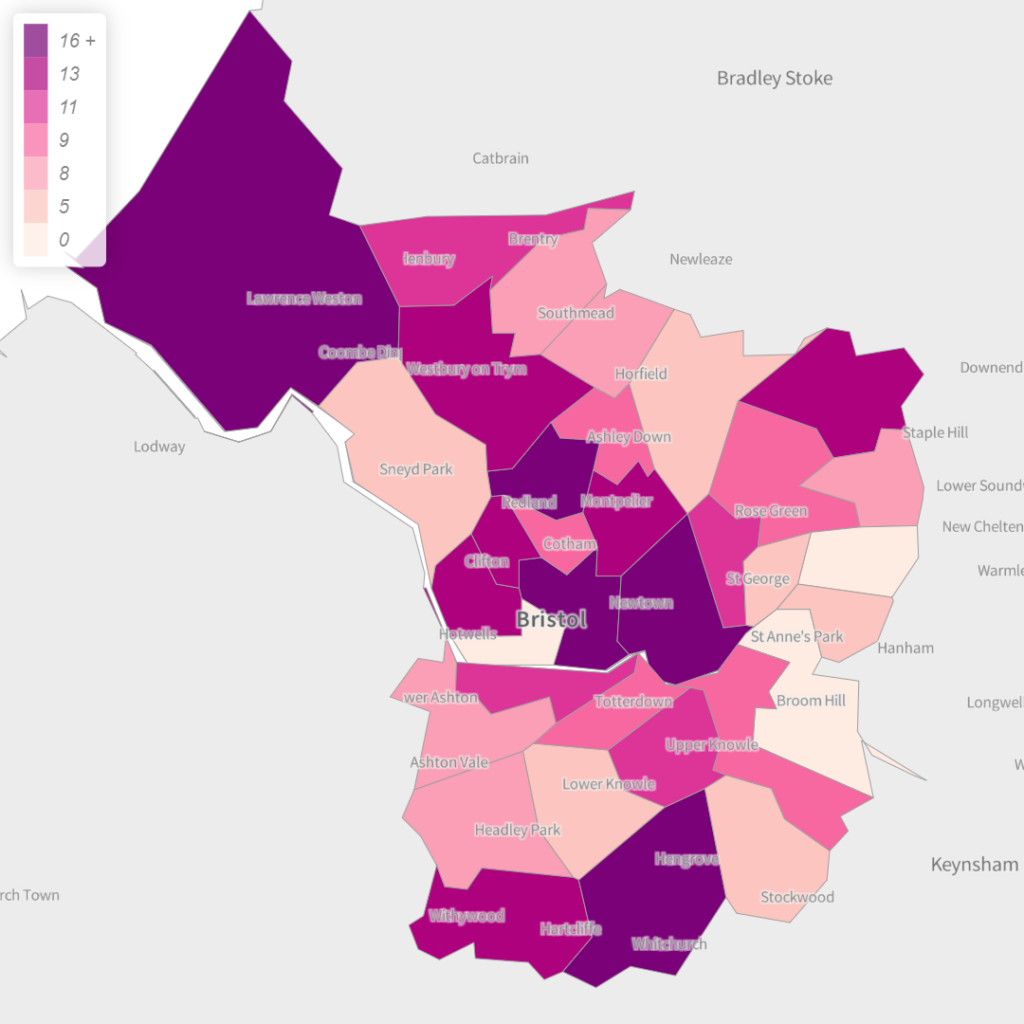
Bristol
Sales for Q1
How to create a UK city heatmap?
Step 1
Follow steps one and two from Create a postcode heatmap in three easy steps.
Step 2
Now from the boundary dropdown pictured below, select which city you would like to aggregate your postcode data by.
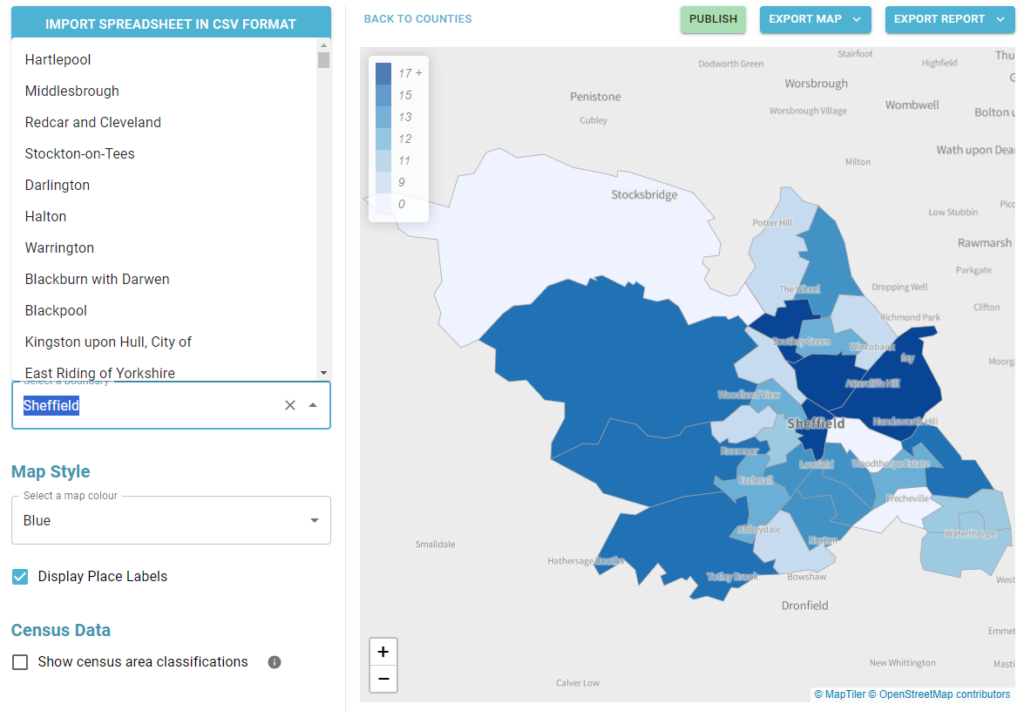
And that’s it! You can now export your map as an image to use in your own reports and presentations.
Visit postcodeheatmap.com to create your own UK city heatmap.