In this post we are going to demonstrate how you can use Postcodeheatmap.com to easily create a beautiful heatmap visualisation of London.
Step 1
Follow steps one and two from Create a postcode heatmap in three easy steps.
Step 2
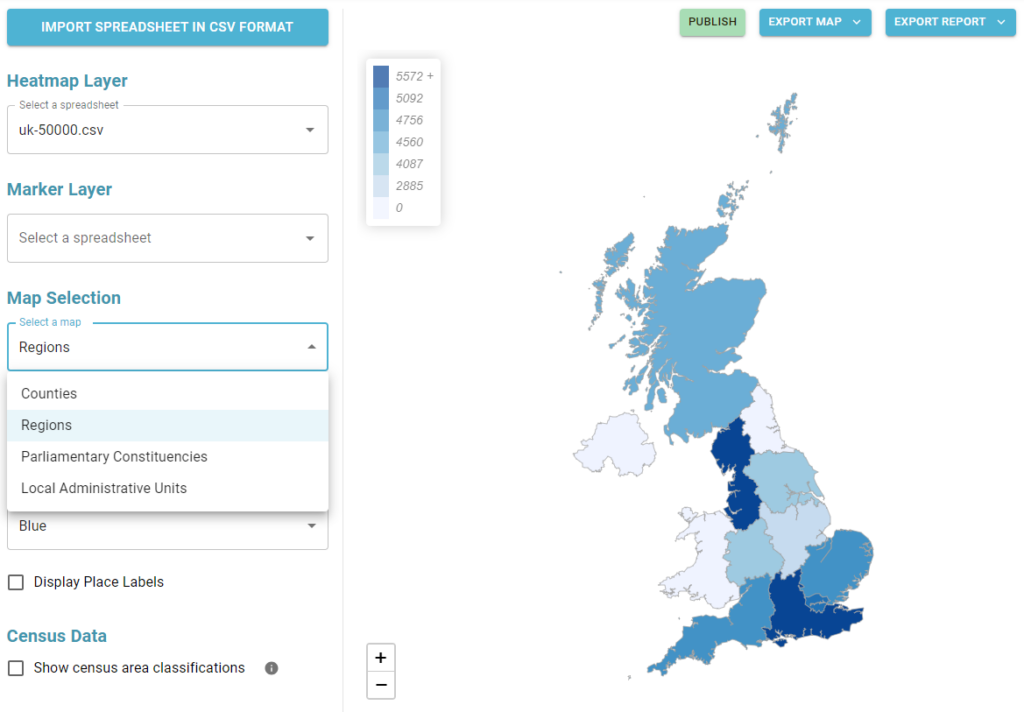
From the map dropdown pictured below select “Region”. This will then display a high level heat map of your data based on UK regions.
Step 3
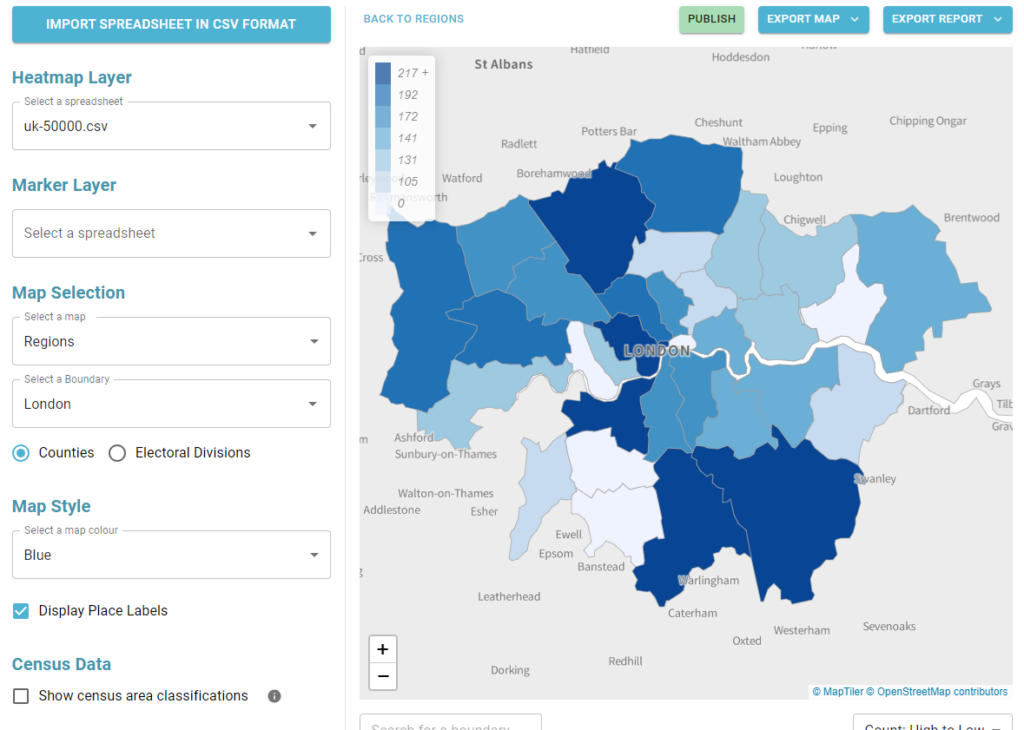
Now from the boundary dropdown pictured below, select “London”.
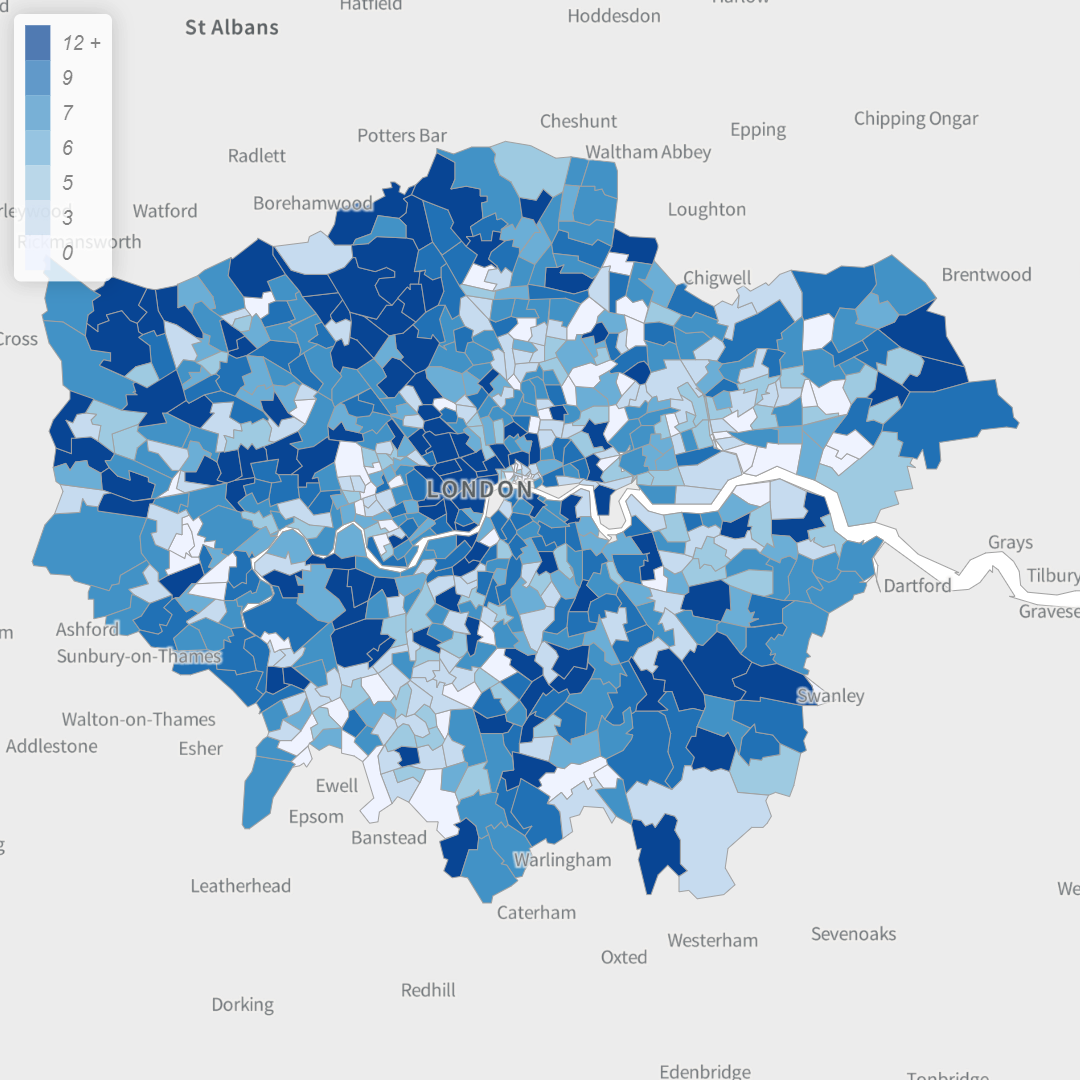
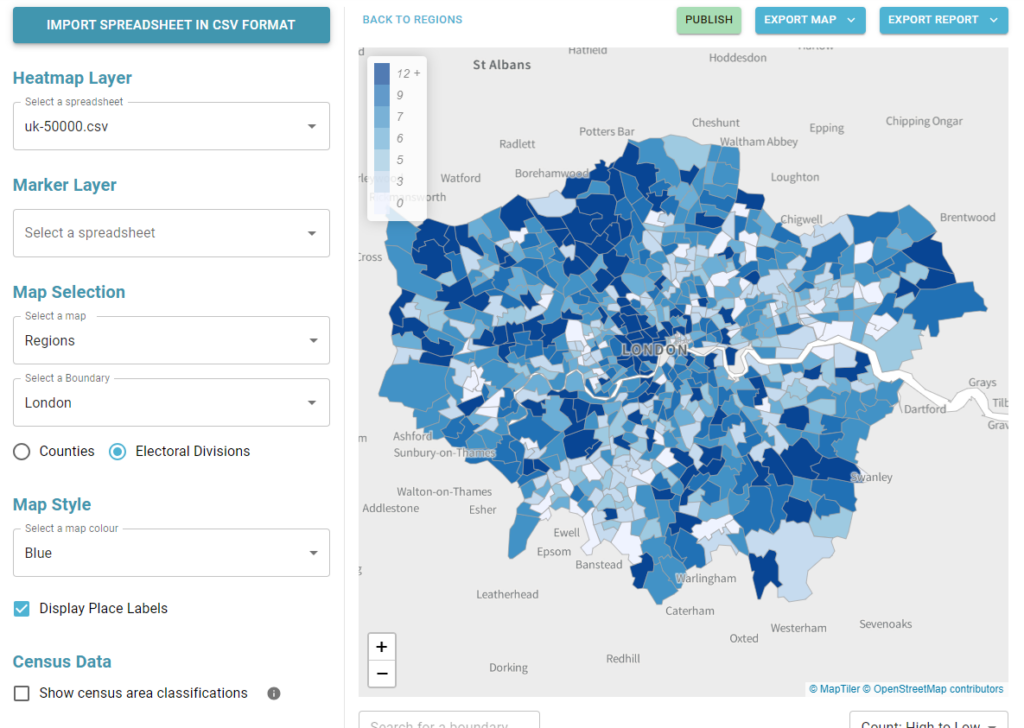
If you then want a more granular aggregation you can choose to display your data by “Electoral Divisions”.
You are now ready to export an image of your heat map or generate reports on the aggregated data.