A postcode heatmap could be a great way to visualise Shopify customer orders because it shows data across different regions using colour shading. Here’s how it would work for customer orders:
- Colour Coding by Order Volume: Different regions (like regions and counties) on the map can be shaded in varying colours based on how many orders were placed. For example, darker colours might show areas with more orders, while lighter colours show areas with fewer.
- Quick Identification of High-Activity Areas: You can immediately see where most orders are coming from. If one region is dark, it tells you at a glance that you have a lot of customers there, which might be helpful for marketing, stock planning, or even opening new warehouses.
- Spotting Trends and Patterns: By using a postcode heatmap, you might notice trends over time or differences in order volume across regions. For example, you might see that one region consistently has high orders during certain seasons, helping you tailor promotions or inventory accordingly.
In short, a postcode heatmap makes it easy to see where your Shopify orders are concentrated, helping you make smarter business decisions by understanding your customer distribution visually.
To easily create a heatmap from your Shopify orders, simply sign up to postcodeheatmap.com and follow these steps.
Step 1: Export your Shopify Orders
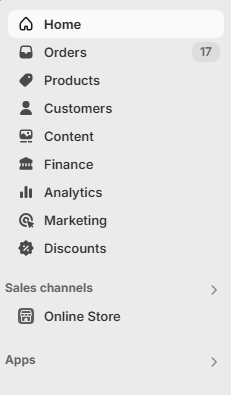
Log in to your Shopify stores admin dashboard and navigate to the orders page via the left-hand sidebar on the screen.
Once you have navigated to the orders page you will see a list of all your Shopify orders. You will also notice in the top right of your screen a button labelled “export”. Clicking this will allow you to download all of your Shopify orders to a csv file.
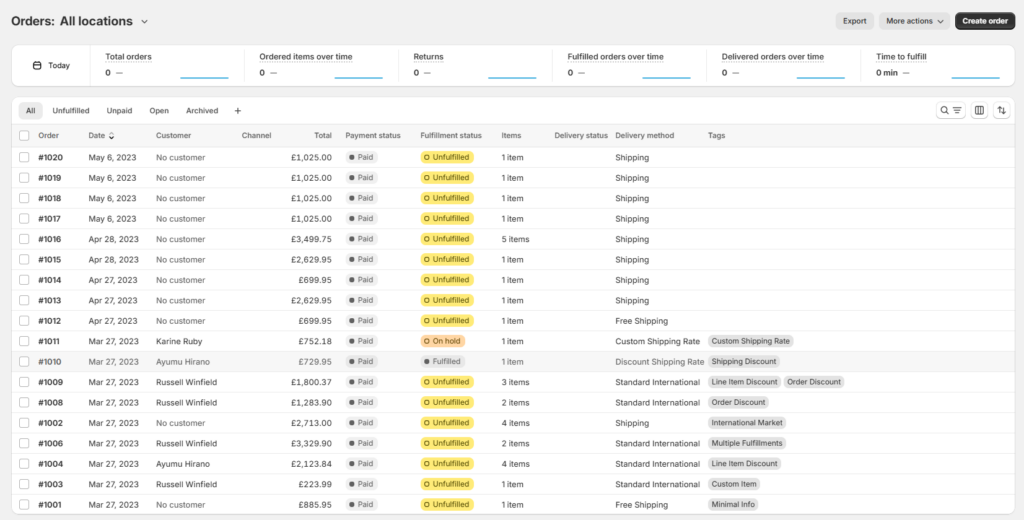
Go ahead and click the export button.
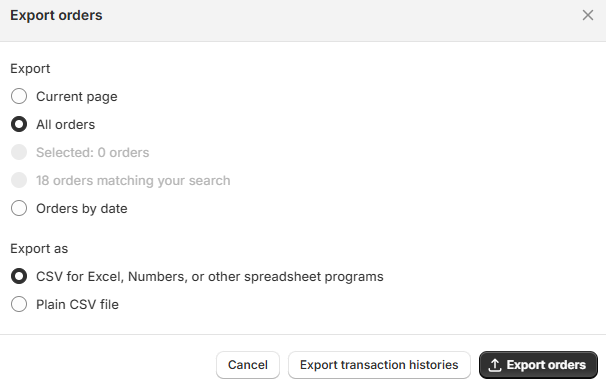
You can export either as a csv for Excel or a plain csv file. Either one will be fine. Once you have exported the orders, the csv file will be downloaded to your computers Downloads folder.
Step 2: Create your Shopify orders heatmap
Sign up to postcodeheatmap.com and once signed in you can jump into getting started with creating your map straight away. Firstly, click the big blue button labelled “Import Spreadsheet in CSV Format”.
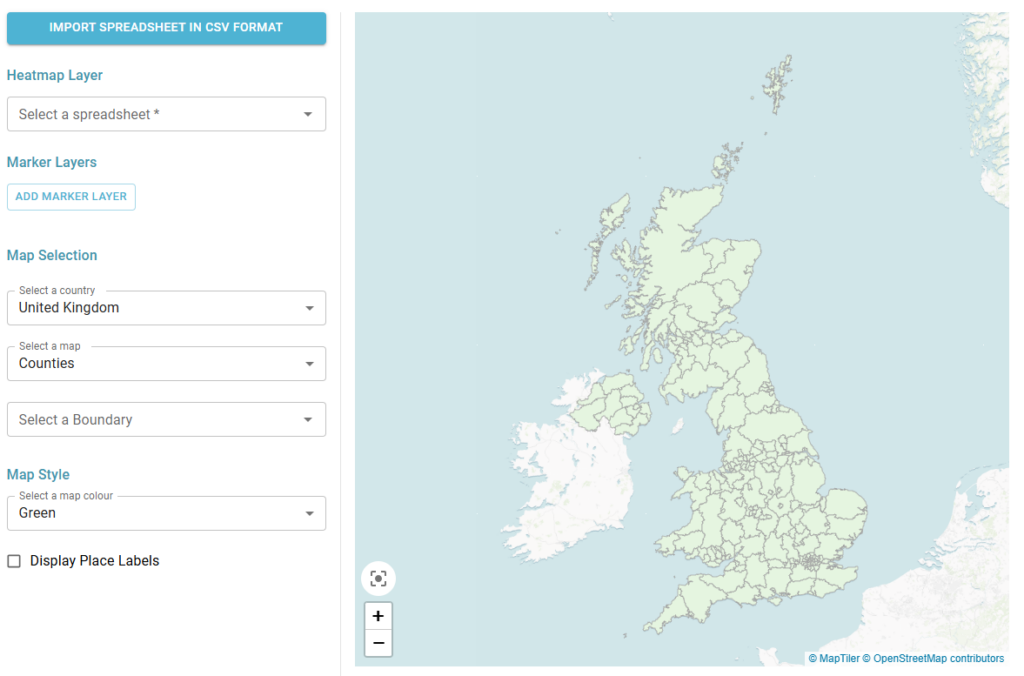
Select the file you had previously exported from your Shopify dashboard from your computers Downloads folder. You should then see a preview of your Shopify orders spreadsheet displayed.
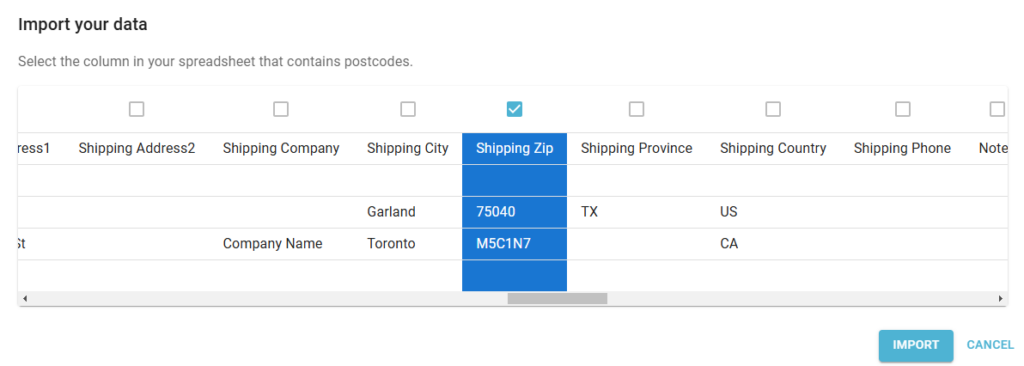
Now select either the Billing Zip or Shipping Zip column from the spreadsheet – this tells Postcodeheatmap where the postcodes are in your spreadsheet. Finally, click the import button.
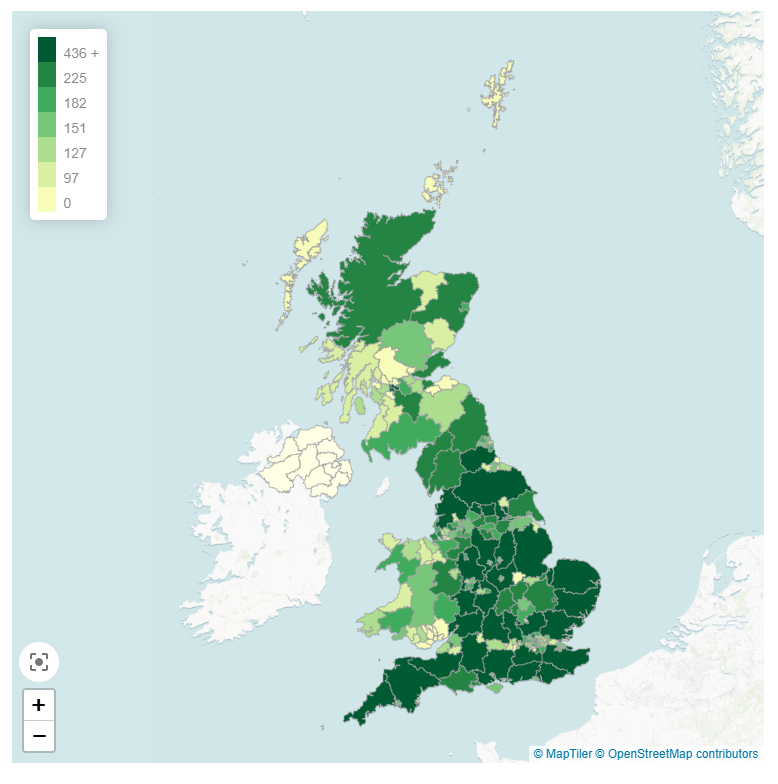
Once your spreadsheet has been successfully imported you will now be able to view your Shopify orders heatmap.
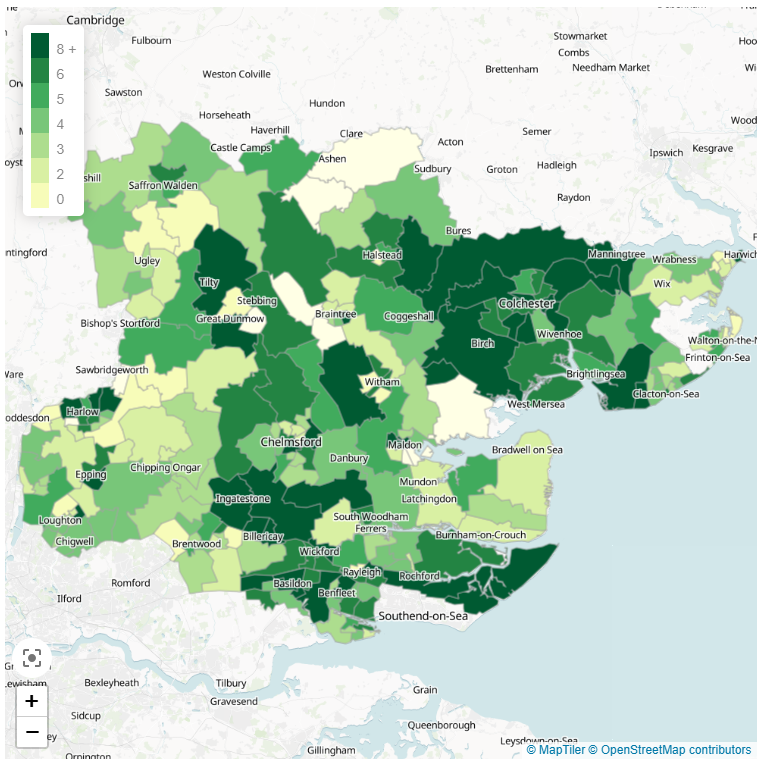
You can now use Postcodeheatmap to customise your map, aggregate your Shopify orders data by other geographic boundaries such as counties and even drill down into specific boundaries to get a more detailed view.
Step 3: Export and share
Once your Shopify orders heatmap has been generated you can then export the map as a high resolution image, or you can publish your map and share it via a unique sharing link or embedding it in your own website.


And it is as simple as that! To try out creating your own Shopify orders heatmap, sign up to postcodeheatmap.com.
